Top Call Statistics: What’s been your experience?
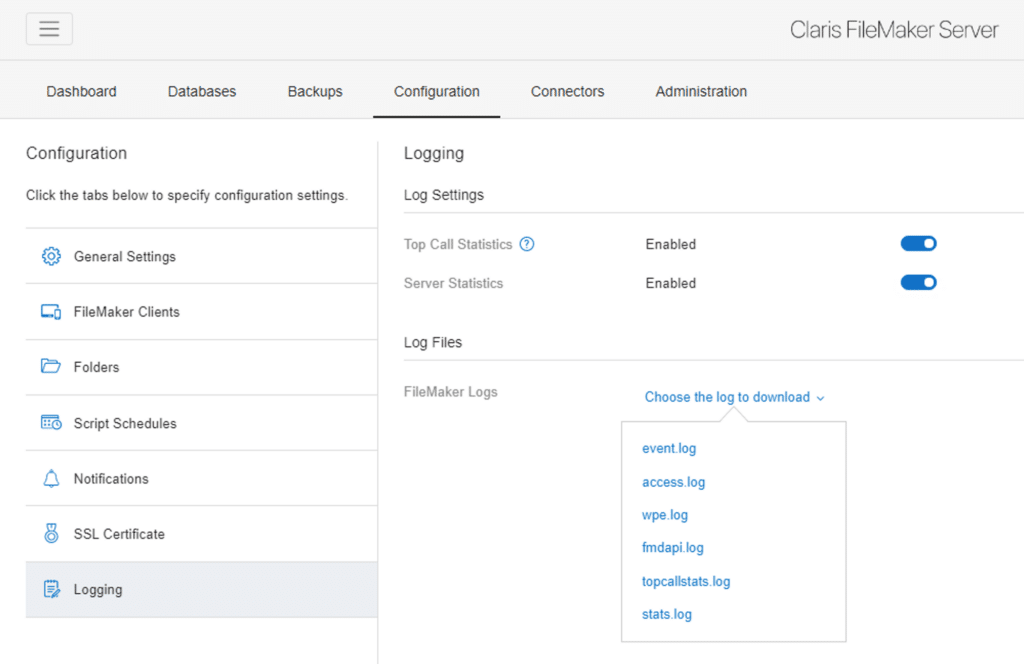
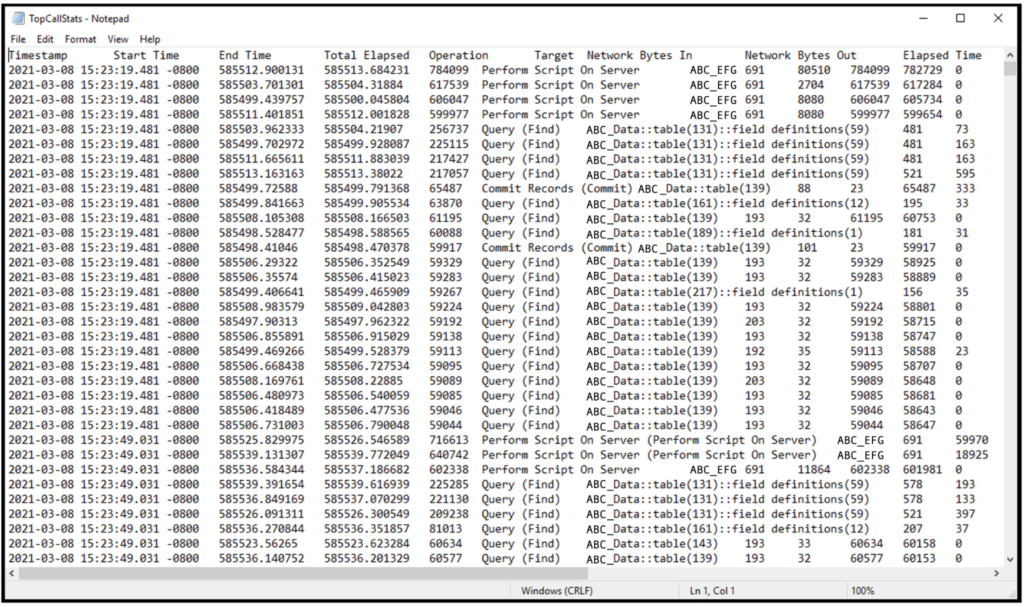
Top Call Statistics was introduced by Claris in 2015. This log captures the top twenty-five most expensive calls in your solution, measured by execution time, and allows you a more detailed view of what may be causing slowdowns or interruptions in performance or in an end-user’s experience. When enabled, you can download a report similar to an event log. This first image shows where you would enable the feature in the FileMaker Server admin panel, and where you can download the log. The second image shows what the log looks like.
There are numerous, excellent articles and videos explaining the function, use, and benefits of Top Call Statistics (see a list at the end of this post), but Claris itself advises against leaving the logging on for long durations since the “process may negatively impact server performance.” In a way, evaluating whether or not to enable this feature has seemed similar to making an online purchase of an unfamiliar item. You’ll find 4,627 four and five-star ratings extolling the virtues of the purchase in question, but the sum of the one, two, and three star reviews is enough to make you reconsider. You’re left in a sort of Pin the Tail on the Donkey situation, hoping to come out of the spin well and land your aim as accurately as possible.

A chance to remove some of the guesswork!
We recently had an opportunity to make a solid, real-life comparison of Top Call Statistics enabled versus disabled in a user-heavy, multi-office solution. We’ll describe our scenario and observations in the remainder of this article. Then we’d also like to ask YOU … what’s been your experience? We’d love to hear your perspective and results, which will help the entire Claris FileMaker community gain a better understanding of how Top Call logging is best used. Feel free to comment on this post or send us a message through our Contact Form.
Background for our comparison
The environment is a healthcare company using a Claris FileMaker 19 solution in their eighteen offices. Offices are located throughout the United States, spread across time zones, though concentrated on the East and West coasts. The application is not transactionally intensive, but there are a healthy number of concurrent users – approximately 60 to 70 during peak usage.
Our client was experiencing significantly reduced response times on some patient records, while navigating from tab to tab. On these known “slow” patients, users would sometimes have to wait over 30 seconds for the page to load after clicking certain tabs, with most tabs averaging 12-15 seconds. In comparison, records considered to be “normal” would only take about 1-3 seconds for tabs to load.
We traced the bulk of the delays to how the medication syncing process was taking place. (Medications are synced from an outside vendor with a patient’s record when a user navigates into one of three tabs and users also have the ability to refresh the sync at any time.)
Troubleshooting this performance issue necessitated objective performance tests to be certain we were testing the slow behavior accurately and to show our client the degree of performance improvement. Since we had the necessary data anyway, we decided to also test with Top Call Statistics enabled and disabled to see what kind of performance difference existed.
How we tested
As part of our discovery process, we set up a testing scenario to track navigation speeds. We had legacy data from previous testing and so mapped our parameters from those details and then created a tracking database to house the results. We chose five patients in two offices. Two patient records were known to respond extremely slowly when navigating through their details, while the other three were reported by staff to be quick and responsive.
We conducted weekday tests during mid-day, when a high of 50-60 users would be in the system, along with weekend tests to get a baseline for when the system was at minimal load of generally 1-5 users.
Our process was to open a patient record and then navigate through our chosen series of steps, noting the page load times along the way. In the first office, we would test on Patient A, then Patient B, then Patient C and then repeat that cycle three times. We would then log in to the second office and repeat the process with Patient D and Patient E. This method provided an average result for each testing point, across about a ten minute window for each patient, instead of just measuring a single moment in time. We enabled Top Call Statistics for some tests, and left it off for others.
Our database captured these types of details for each test of each patient record:
Our observations
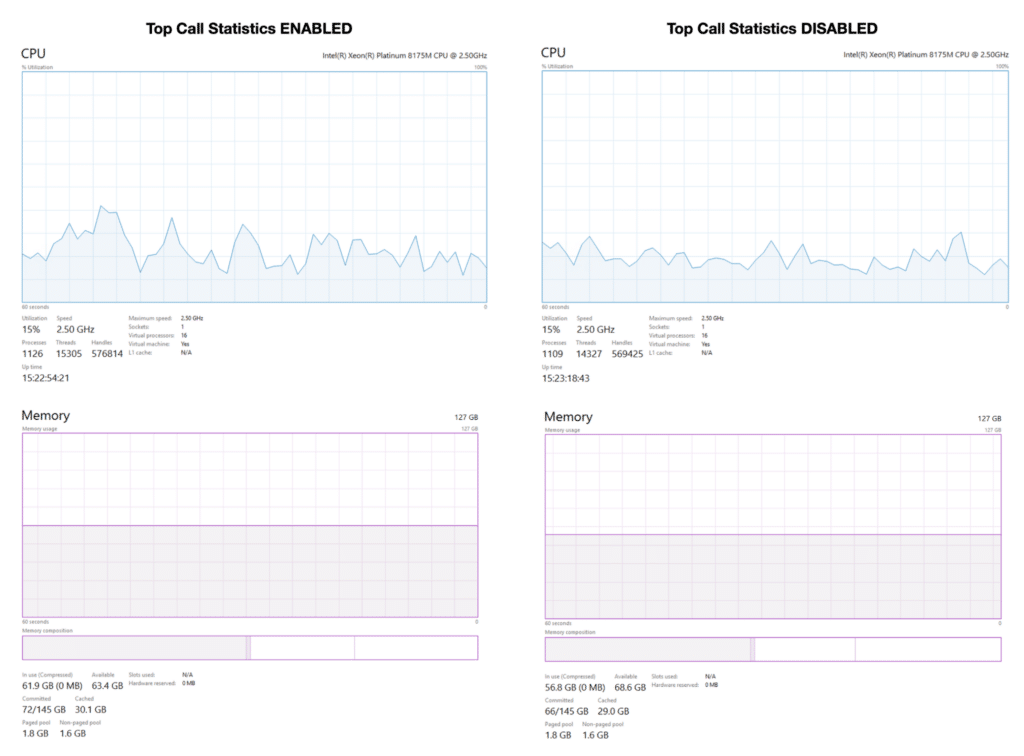
Through twenty-five testing sessions over a four month period, we did not notice any perceptible difference in performance with Top Call logging enabled versus disabled. Average response times remained comparable, as well as CPU and memory usage. You can see a sample of the comparison of data in these screenshots below and these similarities held true across the spectrum of testing.
Our conclusions
We were expecting to see definite differences and were pleasantly surprised that we did not. Based on our observations, we have decided to enable Top Call Statistics more broadly. These changes have been in place for nearly two months and we haven’t seen a rise in issues or problems. With Top Call logging enabled on these servers, we will be better prepared to troubleshoot performance issues in the future.
We’ve gathered a few helpful articles, for further research into this topic.
-
FileMaker Server Top Call Statistics Logging, Soliant Consulting
-
Demystifying Top Call Stats, 360Works
-
Top Call Stats Log Analysis, FMPerception
-
FileMaker Server Top Call Logging, DB Services
We’d love to hear your perspective
Please chime in by commenting below and let us know what you’ve seen with Top Call Statistics and why you prefer to enable it or why you don’t. We look forward to hearing more aspects of this topic and broadening our understanding overall. If we can help with your Claris FileMaker solution or programming questions, send us a note as well!