
Give this demo a try yourself! This app is publicly available here.
I had what seemed like a simple idea: upload my FileMaker Server log files to an LLM and let AI do the heavy lifting. Find orphaned logins. Spot error patterns. Chart peak usage. The kind of analysis that’s tedious by hand but should be a natural fit for a language model that can process structured text.
Chatting with the AI about a large log file didn’t work very well initially! What followed was a months-long detour through token limits, platform quirks, and a growing realization that the real solution wasn’t to force my logs into an LLM—it was to build the analysis tools myself and let AI help me write the code.
This is that story.
What I wanted to know
My log analysis questions fell into a few categories:
• Usage: What were the peak usage counts – how many users, what days? Who was the last user to log in to certain files, and when was that login?
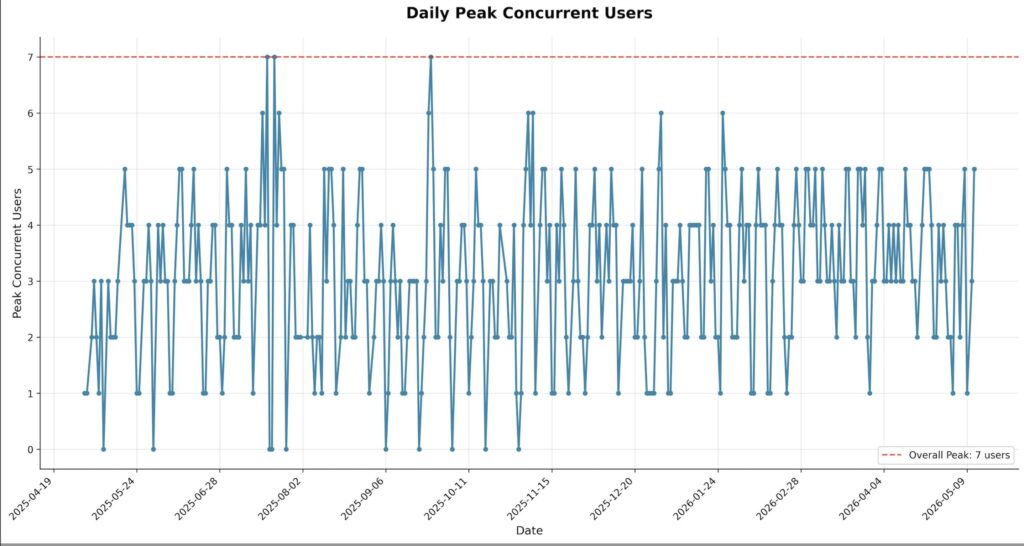
• Visualizations: A line chart of users by login count. A line chart of peak concurrent logins per day.
• Statistics: The top 5 users by login volume, broken down by database.
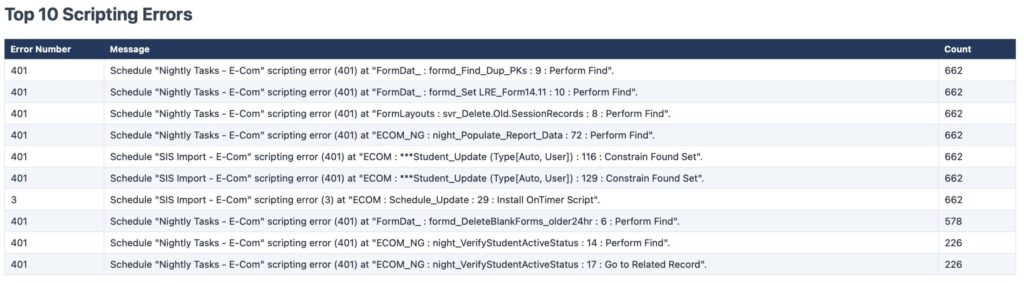
• Error Review: The top 10 scripting errors, excluding the common noise like error codes 401, 3, and 101.
Reasonable questions. The kind of thing you’d expect an LLM to handle if you could just hand it the data.
The token trap
The first wall I hit was file size. A production FileMaker Server generates large log files—my TopCallStats.log alone was 21 MB. I tried uploading it to NotebookLM, Gemini, and ChatGPT. NotebookLM and Gemini refused outright. ChatGPT threw an “unknown error” on upload (Tip: it strongly prefers .txt file extensions over .log).
When I dug into the refusals, the numbers were brutal. That 21 MB log file contained an estimated 9.2 million tokens. At the time, Gemini’s chat interface had a context window of roughly 1 million tokens. I was off by a factor of ten. No amount of prompt engineering was going to close that gap.
Why your log file blows up the token count
If you’re going to work with LLMs and large data files, it helps to understand why this wall exists. It comes down to how these models consume text.
An LLM doesn’t read text the way you do. Before it processes anything, it breaks your input into tokens—fragments that might be whole words, parts of words, or individual characters. The word “unbelievable” becomes three tokens: “un,” “believe,” and “able.” This approach is how the model handles the full diversity of language efficiently—rare words, conjugations, technical jargon—without needing a separate entry for every possible word form.
The constraint that matters is the context window: the total number of tokens the model can hold in memory at once. Everything has to fit—your uploaded file, your question, and the model’s response. Exceed the window, and the model loses the beginning of the input. It’s not summarizing or compressing; it literally cannot see those early tokens anymore. For log analysis, where you need the model to correlate entries across thousands of lines, that’s a dealbreaker.
Here’s the part that makes FMS logs especially expensive: log data is the worst possible content for token efficiency. Every line contains timestamps with milliseconds, timezone offsets, IP addresses, GUIDs, and long file paths. None of these compress well into tokens. A line of prose might average 1.3 tokens per word. A line of FMS log data can easily hit three to four tokens per word-equivalent, because the tokenizer has to break those long technical strings into many small pieces.
That’s why a 21 MB log file balloons to 9.2 million tokens. It’s not just big—it’s token-dense. Understanding that distinction is the key to figuring out what will and won’t fit in an LLM’s context window.
The pivot: Stop feeding logs to AI – use AI to build the tools
Once I accepted that no LLM was going to digest a raw 21 MB log file, the path forward became clear: instead of asking AI to analyze the logs directly, I’d use AI to help me write the code that does the analysis.
I started in VS Code with an AI code assistant, building Python scripts one at a time. The first script was simple: truncate a log file to the last N days so I could at least get a manageable slice into an LLM for exploratory questions. But the process quickly grew beyond that.
From one script to eleven
Each question I had about the logs turned into its own focused Python script. The iterative process with the AI assistant was real—there were false starts. The first version of the login analyzer reported orphaned logins when I’d asked for total logins. The line chart implementation needed several rounds of corrections. But the AI was genuinely good at the tedious parts: parsing timestamp formats, handling edge cases in regex, and generating matplotlib charts.
Here’s what I ended up building:
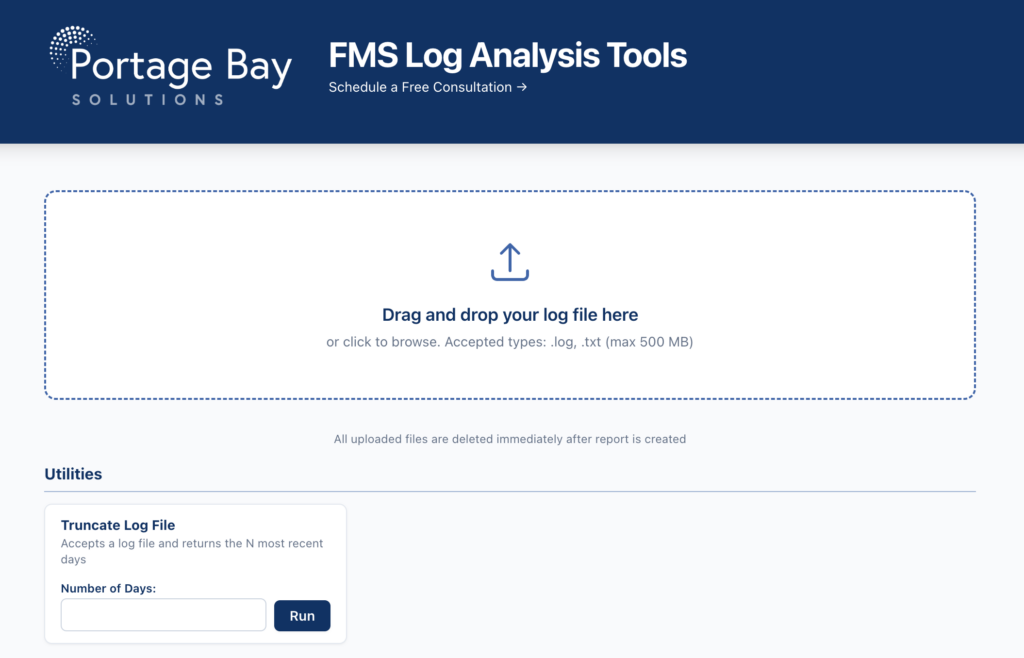
1. Log Truncation – Trim any log to the last N days. This workaround started everything.
2. Concurrent Session Analyzer – Track overlapping user sessions and chart peak concurrent logins over time.
3. Database User List – Extract every unique user who’s accessed a specific database.
4. File Analysis – A databases-by-year crosstab showing login counts—useful for spotting databases that are falling out of use.
5. User Activity Summary – Per-user login counts across all databases for the trailing 12 months.
6. Recent Access Grid – The three most recent logins per database with usernames and dates—a quick snapshot of who’s active where.
7. Average Session Duration – Session counts and average duration per user per day.
8. Client Version Tracker – Identifies which FileMaker client applications and versions are connecting to the server.
9. Top Call Profiler – Ranks server operations by average elapsed time to surface performance bottlenecks.
10. Script Error Summary – Parses the ScriptEvent.log and generates an HTML report of the top 10 scripting errors, excluding certain common ‘noise’ errors.
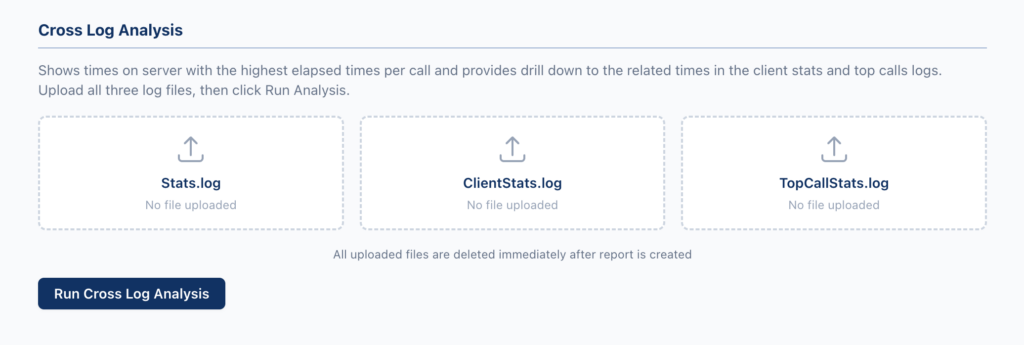
11. Cross-Log Correlation – The most ambitious one: it reads Stats.log, ClientStats.log, and TopCallStats.log simultaneously and produces two HTML reports that cross-reference server performance with client activity.
Every script follows the same pattern: accept a log file as input, parse it with targeted regex, and produce a focused output—text, HTML, or a ZIP archive with charts. No LLM in the loop at runtime. No token limits to worry about.
Wrapping it in a web app
Eleven command-line scripts are useful, but they’re not exactly user-friendly. So the next step was obvious: give them a proper interface.
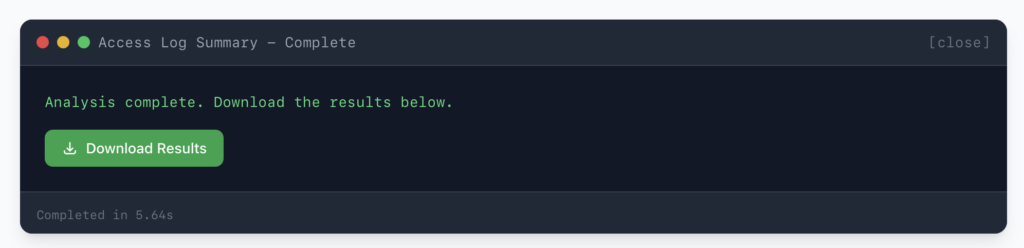
I built a Flask web application with a drag-and-drop upload zone, a gallery of analysis scripts to choose from, and a terminal-style results console. Upload a log file, pick a script, set any parameters, click run. The app calls the Python script as a subprocess, captures the output, and serves the results—either as downloadable files or inline in the browser.
I have the cross-log analysis its own dedicated interface since it needs three separate files uploaded at once. I wrote the whole thing with lots of help from Claude, and it runs in Docker with a two-stage build/deploy via GitHub. Node.js compiles the Tailwind CSS, then a Python slim image runs the Flask app behind Gunicorn.
Am I an expert on all this? No, but it’s been a great little project for expanding my skills. It’s not terribly fancy, but the app lets you upload your log files and get results back quickly.
Do you have some ideas for a good analysis script you think would be helpful to other people? Shoot me an email and I’ll see about adding it to this page, john@portagebay.com.
Customizing the AI for what it’s good at
I didn’t abandon LLMs entirely in my approach to directly interacting with the log files. For smaller, pre-processed data, like a smaller log fragment, AI is still very useful for analysis and pattern recognition.
I created a custom GPT specifically for FileMaker log analysis. I instructed it to stay technical, skip the pleasantries, and never fabricate data it doesn’t have. I fed it reference material including PDFs of blog posts on FMS log analysis (one of which I’d written years ago). The result is a focused assistant that can interpret the summarized output from my scripts and help me dig deeper—within the bounds of what actually fits in its context window. Skill with Claude would also be excellent for this type of venture.
The key insight: use LLMs where they excel (code generation, pattern interpretation on manageable data) and purpose-built tools where they don’t (processing multi-megabyte files).
You can still chat with your logs—you just need to trim them first
Here’s the thing I don’t want to get lost in my story about building the portal: talking to an LLM about your log data is still valuable. The problem was never the concept—it was the file size. And that’s a solvable problem.
This purpose is exactly why the log truncation utility exists in the portal. It’s the bridge between your raw production logs and a productive AI conversation. Take your Access.log, trim it to the last seven days, and suddenly you’ve got a file that fits comfortably in a modern LLM’s context window. For heavier logs like TopCallStats.log, you might only get a day or two—but even a day’s worth of top call data can reveal patterns you’d never spot manually.
The workflow is straightforward: run the truncation script in the portal, download the trimmed file, and upload it to Claude, ChatGPT, or whatever LLM you prefer. Then start asking questions. And here’s where things get genuinely interesting, because the kinds of questions you can ask go far beyond what a static script can answer.
Access Log
• “Show me unusual patterns that appear in this file from day to day.”
• “There is a cluster of connections opening at 2:15 AM every night using the Admin account. Based on the database names and timing, speculate on possible explanations.”
TopCallStats Log
• “The elapsed time for Find operations on this one table spikes every day around 1 PM. The rest of the day it’s fast. What could cause a find to slow down at a specific time?”
• “I’m seeing a lot of Sort operations with high elapsed times targeting the same table. What are some possible explanations?”
ScriptEvent Log
• “This script throws error 401 on line 47, but only when triggered by one specific user. The same script runs clean for everyone else. What are some likely causes?”
• “I see a sequence where error 301 fires on one script, then error 500 fires on a different script about 10 seconds later. These are in different files. Could these be related?”
The power here is the follow-up conversation. A static script gives you a summary. An LLM lets you interrogate the data. You can ask “why” and “what else” in ways that a Python script can’t anticipate. The truncation utility makes this possible by getting your logs down to a size the AI can actually work with—and once they’re in the context window, the conversation can be very productive.
What’s next
The log analysis dashboard handles the fundamentals well, but I’d like to add more analysis scripts. The deeper questions—the ones that require correlating patterns across multiple logs, servers, and time windows—are where this gets interesting. If you have ideas, please shoot me an email.
Here are some areas I plan to continue exploring:
Pattern and error correlation
Are there patterns between ScriptEvent.log entries and TopCallStats.log entries?
Are there users with login patterns that differ significantly from the rest?
Do certain top calls repeat at specific times of day?
Are there patterns in the script event log that might point to consistently failing operations?
Which scripts have the most errors, and what are the error codes?
Comparative and multi-server analysis
Compare the ScriptEvent.log error distribution across two different servers running the same application.
Identify patterns in the stats log that indicate performance degradation patterns.
Compare usage patterns between two servers running different applications.
The takeaway
The promise of “just upload your data and let AI figure it out” isn’t there yet for large-scale log analysis. Context windows are growing, but production FileMaker Server logs will stay ahead of them for a while.
The practical answer is a hybrid approach: use AI to write focused analysis scripts, package them in a tool that anyone can use, and keep LLMs in the loop for interpretive work on manageable data.
I started this project trying to get an LLM to read my logs. I ended up building something perhaps more interesting—a dedicated analysis portal with eleven purpose-built scripts that handle any file size, produce consistent results, and don’t cost me tokens every time I run them.
Sometimes the best use of AI isn’t asking it for the answer. It’s using it to build the tool that gives you the answer.
Addendum: FileMaker Server Log File Reference
The following sections detail the columns and content of various FileMaker Server log files, which are crucial for effective log analysis.
ClientStats.log
The FileMaker Server ClientStats.log file, when enabled, provides a summary of statistics for each connected client during a specific collection interval. The columns are:
- Timestamp: The date and time when the statistics for that client were recorded for the collection interval.
- Client: Identifies the client. The format varies:
- FileMaker Pro or FileMaker Go: The user’s login name.
- ODBC/JDBC Clients: A machine identifier along with the IP address.
- Web Publishing Clients (WebDirect, Custom Web Publishing): A machine identifier with an IP address (WebDirect might be a session ID).
- FileMaker Data API Clients: The user login name and client IP address or host name.
- Remote Calls: Total number of remote calls completed by this client during the collection interval.
- In Progress: Number of remote calls initiated by this client still pending completion at the end of the interval.
- Elapsed Time: Total elapsed time, in microseconds, for all completed and in-progress remote calls.
- I/O Time: Total time, in microseconds, the client’s thread spent waiting for disk I/O.
- Wait Time: Total time, in microseconds, the client’s thread spent waiting for other threads or resources on the server.
- Net Bytes In: Total bytes received by the FileMaker Server from this client.
- Net Bytes Out: Total bytes sent by the FileMaker Server to this client.
Stats.log
The Stats.log file records various server performance metrics over time. The columns typically include the current, average, low, and peak values for the following statistics:
- Timestamp: Date and time of the statistic collection interval.
- Cache Hit %: Percentage of data retrieved from the cache (RAM).
- Cache Unsaved %: Percentage of the cache that hasn’t been written to disk.
- Disk KB/sec Read: Rate of data read from the hard disk.
- Disk KB/sec Written: Rate of data written to the hard disk.
- Network KB/sec In: Rate of data received by the server.
- Network KB/sec Out: Rate of data sent by the server.
- Remote Calls/sec: Number of remote calls received per second.
- Remote Calls In Progress: Number of remote calls pending completion.
- Elapsed Time (µs)/call: Average time to process a remote call.
- I/O Time (µs)/call: Average time a remote call waits for disk I/O.
- Wait Time (µs)/call: Average time a remote call waits for other processes.
TopCallStats.log
The TopCallStats.log file logs detailed information about the client requests that have the longest elapsed time during each statistics collection interval (default 30 seconds).
- Timestamp: The Database Server timestamp at the end of the interval.
- Start Time: Timestamp at the start of the remote call (in seconds since Database Server process started).
- End Time: Timestamp at the end of the remote call (in seconds since Database Server process started). Empty if the call is still in progress.
- Total Elapsed: Total microseconds elapsed for the remote call up to the point of logging.
- Operation: The name of the remote call being performed (e.g., “Query”, “Upload”).
- Target: The name of the hosted file and potentially the specific object being accessed (e.g., <filename>::<tableID>).
- Elapsed Time: The portion of the Total Elapsed time that occurred within the current statistics collection interval, in microseconds.
- Wait Time: Time spent waiting for other clients or resources during the current collection interval.
- I/O Time: Time spent waiting for disk input/output during the current collection interval.
- Network Bytes In: Bytes received by the FileMaker Server from the client for this call during the current collection interval.
- Network Bytes Out: Bytes sent by the FileMaker Server to the client for this call during the current collection interval.
- Client Name: An identifier for the client (e.g., IP address or session identifier).
Event.log
The Event.log records server events.
- Timestamp: The date and time when the event occurred.
- Type/Level: The severity or type of the event (e.g., Information, Warning, Error).
- ID/Code: A numeric code associated with the specific event message.
- Server: The name of the FileMaker Server instance.
- Message: A textual description of the event that occurred.
fac.log
The fac.log file is related to the FileMaker Admin API and the Admin Console application.
- Timestamp: The date and time when the Admin API or Admin Console activity occurred.
- Level: The severity or type of the log entry (e.g., INFO, WARNING, ERROR).
- Thread: The specific thread within the Admin API/Admin Console process.
- Class: The internal class or component that generated the log entry.
- Method: The specific function or method that was executed.
- Message: A detailed textual description of the event.
Access.log
The Access.log file records information about clients connecting to and disconnecting from the Database Server, as well as which databases they are accessing.
- Type/Level value is always ‘Information’. (Columns are otherwise similar to Event.log)
wpe0.txt
The wpe0.log file primarily records events related to the Web Publishing Engine (WPE), which handles FileMaker WebDirect and Custom Web Publishing.scriptEvent.txt
The scriptEvent.log file records events related to scripts run by the FileMaker Script Engine on the server (server-side schedules or “Perform Script on Server”).
- Timestamp: The date and time when the script event occurred.
- Severity: Usually “Information” or “Error.”
- Thread: The specific server thread that executed the script.
- Script Name: The name of the FileMaker script that was executed.
- Database Name: The name of the hosted FileMaker database file.
- Account Name: The FileMaker account name under which the script was run.
- Line Number: If an error occurred, the line number of the script step.
- Error Code: The specific FileMaker error code.
- Error Description: A textual description of the FileMaker error.
Bibliography
- Claris Support – Tracking Activity in log files in FMS
- FMS Help Files – Monitoring FMS
- Luminfire’s Blog post and FM Log Viewer utility
- Soliant’s Blog post on FMS Stats Log
- Portage Bay’s post on Top Calls log analysis
- Soliant’s Blog post on Top Call Stats Log
This piece represents a collaboration between the human authors and AI technologies, which assisted in both drafting and refinement. The authors maintain full responsibility for the final content.